📁 data visualization
Chartify
Convert CSV and database tables into rich interactive charts and graphs.
#Artificial Intelligence
#data analysis
#data visualization
#chart

Product Details
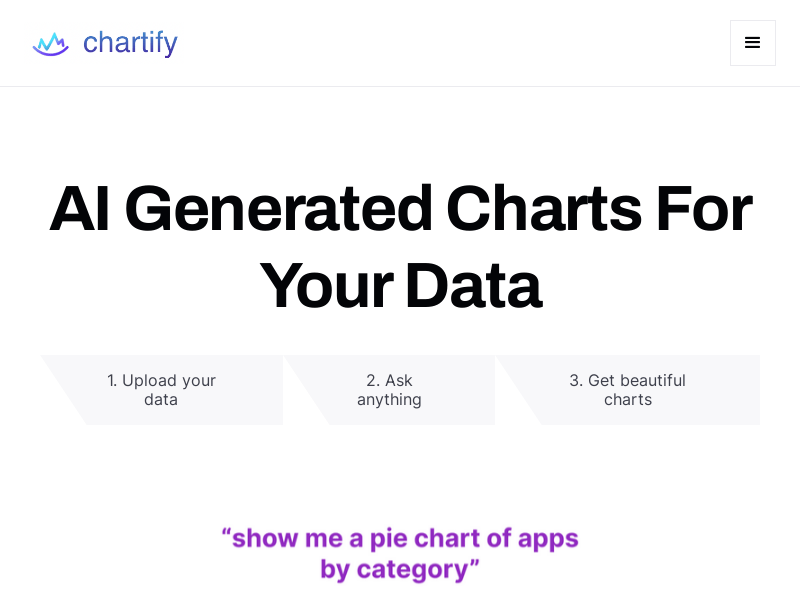
Chartify is a completely new way of interacting with data. No more using frustrating chart editors on Google Sheets and Excel, or manually writing charts in Plotly. Upload your data and we'll instantly display some AI-recommended visualizations. Chartify can also generate a variety of charts based on your needs, from pie charts to line charts and bar charts. Please visit the official website for pricing details.
Main Features
1
Convert CSV and database tables into interactive charts 2
AI recommends new ways to visualize data 3
Generate a variety of charts, including pie charts, line charts, and bar charts Target Users
Chartify is suitable for users who need to convert data into charts for analysis and display, whether they are individual users or corporate users.
Quick Access
Visit Website →Categories
📁 data visualization
› data analysis
› AI design tools
Related Recommendations
Discover more similar quality AI tools
